In the first part of this series, we explored the fundamental of the Check-All-That-Apply (CATA) method and its role in sensory evaluation within the coffee industry. Now, we’ll delve into how coffee businesse like coffee shops and roasteries can apply CATA in their daily operations to gain insights into customer preferences and improve product offerings, As an experienced sensory analyst, I’ll walk you through an imaginary sensory evaluation project using CATA , detailing each step from planning to execution, including the design of an evaluation form and strategies to minimize errors .
Project Overview
Our imaginary project aims to understand customer preferences for different coffee blends offered at a coffee shop . By using the CATA method , we’ll gather valuable feedback that can inform product-development , marketing strategies, and overall customer satisfaction.
Step-by-Step Project Design
1. Defining Objectives
Goal: To identify which sensory attributes customers associate with our top-selling coffee blends and determine their preferences.
Objectives:
- Evaluate customer perceptions of three coffee blends using CATA.
- Identify key sensory attributes that influence customer preference.
- Use findings to optimize product offerings and enhance customer satisfaction.
2. Selecting Coffee Samples
Choose three distinct coffee blends to evaluate:
- Blend A: A light roast with fruity and floral notes.
- Blend B: A medium roast with chocolate and nutty flavors.
- Blend C: A dark roast with smoky and bitter characteristics.
3. Preparing the CATA Evaluation Form
Design an evaluation form that includes:
- Instructions: Clear guidance on how to complete the form.
- List of Descriptors: Sensory attributes relevant to the coffee samples.
- Preference Rating: An optional section for overall liking.
Sample Descriptors:
- Aroma: Fruity, Floral, Nutty, Chocolatey, Smoky, Spicy
- Flavor: Sweet, Bitter, Sour, Salty, Umami
- Aftertaste: Smooth, Harsh, Lingering, Clean
- Body/Mouthfeel: Light, Medium, Heavy, Creamy, Oily
(See the attached evaluation form at the end.)
4. Recruiting Participants
Who: Regular customers visiting the coffee shop over a week.
Sample Size: Aim for at least 50 participants to ensure data reliability.
Incentives: Offer a small discount or a free pastry to encourage participation.
5. Setting Up the Evaluation Space
- Environment: Quiet area within the coffee shop with minimal distractions.
- Materials: Evaluation forms, pens, sample cups labeled with random three-digit codes.
- Serving Samples: Serve coffee samples in a consistent manner (same cup size, temperature, and without additives like milk or sugar).
6. Training Staff
- Brief staff on the purpose of the evaluation and their role in facilitating it.
- Ensure they understand how to instruct participants without leading or influencing their choices.
7. Conducting the Evaluation
Instructions to Participants:
- Taste each coffee sample in the order presented.
- Check all descriptors that apply for each sample.
- Optionally, rate overall liking on a provided scale.
- Data Collection: Collect completed forms ensuring anonymity.
8. Data Entry and Analysis
Data Entry: Input data into a spreadsheet or sensory analysis software.
Statistical Analysis:
Frequency Analysis: Determine how often each descriptor was selected for each blend.
Correspondence Analysis: Visualize relationships between coffee blends and sensory attributes.
Preference Mapping: Correlate sensory attributes with overall liking scores.
9. Interpreting Results
Identify which sensory attributes are most associated with each blend.
- Determine which attributes drive customer preference.
- For example:
- Blend A is frequently associated with “Fruity” and “Floral” and has high liking scores.
- Blend C is often described as “Bitter” and “Smoky” with lower liking scores.
10. Making Business Decisions
- Product Development: Consider adjusting roast profiles or blend components to enhance preferred attributes.
- Marketing Strategies: Highlight favored sensory attributes in promotions (e.g., “Enjoy our fruity and floral light roast!”).
- Customer Education: Provide tasting notes to help customers make informed choices.
Designing the Evaluation Form
Review and Improvement:
- Clarity: Ensure descriptors are easily understandable. Avoid technical jargon.
- Relevance: Include descriptors that are meaningful to customers.
- Length: Keep the list concise to prevent fatigue but comprehensive enough to capture key attributes.
- Order of Descriptors: Randomize or group logically (e.g., by Aroma, Flavor) to minimize order bias.
Avoiding Errors and Controlling Variables
Common Pitfalls:
- Descriptor Overlap: Avoid using descriptors that mean the same thing (e.g., “Nutty” and “Almond”).
- Order Bias: Randomize sample presentation and descriptor order when possible.
- Participant Fatigue: Limit the number of samples and descriptors to keep the evaluation manageable.
- Influencing Participants: Train staff to give neutral instructions and avoid leading comments.
Quality Control Measures:
- Pilot Test: Run a small-scale test to identify and correct issues before the full rollout.
- Consistency: Standardize sample preparation and serving conditions.
- Anonymity: Keep responses confidential to encourage honesty.
Conclusion
By integrating the CATA method into daily operations, coffee businesses can gain actionable insights into customer preferences without significant investment in time or resources. This approach not only enhances product offerings but also strengthens customer relationships by showing a commitment to meeting their tastes and expectations.
Coffee Sensory Evaluation
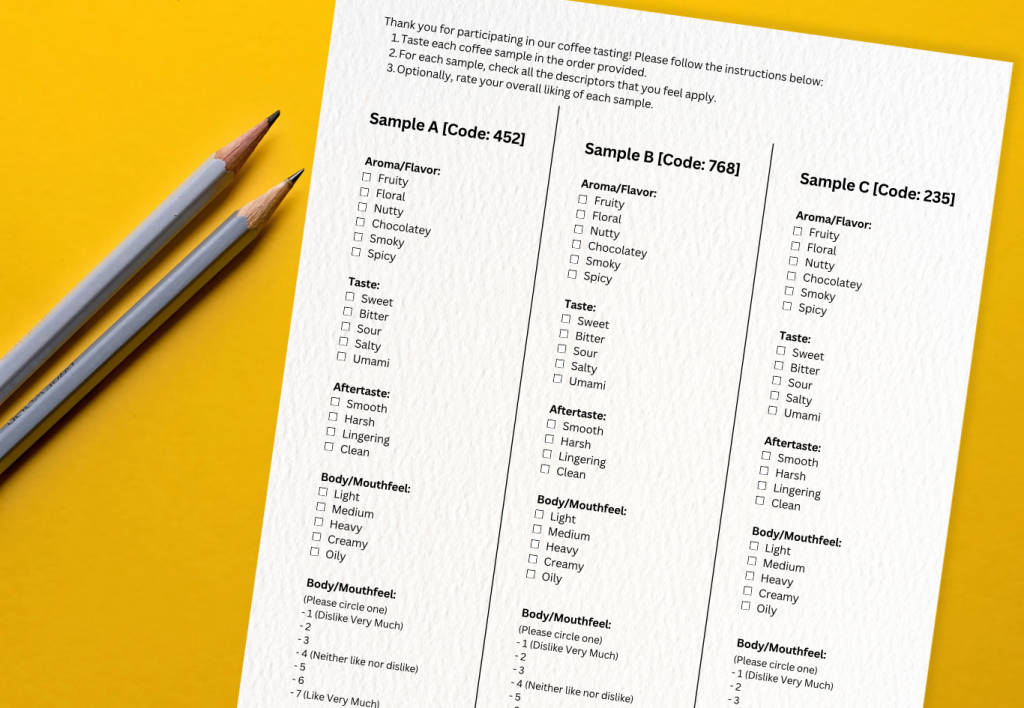
Thank you for participating in our coffee tasting! Please follow the instructions below:
- Taste each coffee sample in the order provided.
- For each sample, check all the descriptors that you feel apply.
- Optionally, rate your overall liking of each sample.
Sample A [Code: 452]
Aroma/Flavor:
• Fruity
• Floral
• Nutty
• Chocolatey
• Smoky
• Spicy
Taste:
• Sweet
• Bitter
• Sour
• Salty
• Umami
Aftertaste:
• Smooth
• Harsh
• Lingering
• Clean
Body/Mouthfeel:
• Light
• Medium
• Heavy
• Creamy
• Oily
Overall Liking:
(Please circle one)
– 1 (Dislike Very Much)
– 2
– 3
– 4 (Neither like nor dislike)
– 5
– 6
– 7 (Like Very Much)
(Repeat the same for Samples B and C)
Next Steps and Future Considerations
- Feedback Loop: Share findings with staff and consider hosting training sessions to align product preparation with customer preferences.
- Repeat Assessments: Conduct regular evaluations to stay updated on changing customer tastes.
- Expand Scope: Consider using CATA for new products or seasonal offerings.
Final Thoughts
Implementing the CATA method empowers coffee businesses to make data-driven decisions that enhance customer satisfaction and competitive advantage. By systematically capturing and analyzing customer perceptions, businesses can tailor their offerings to meet market demands effectively.
Coffee Sensory Evaluation
Thank you for participating in our coffee tasting! Please follow the instructions below:
- Taste each coffee sample in the order provided.
- For each sample, check all the descriptors that you feel apply.
- Optionally, rate your overall liking of each sample.
Leave a Reply